Automated Highlights Detection
Master's thesis research using YouTube's "Most Replayed" feature for automated highlight detection in long-form videos, achieving competitive performance with transformer-based models.
Research Overview
My Master's thesis addressed a critical gap in video analysis: traditional highlight detection requires expensive manual labeling (~$15,000 for 10,000 videos) and focuses mainly on short videos (<5 minutes). I developed a novel approach using YouTube's "Most Replayed" feature as training data for long-form videos (3.5-30 minutes).
This was the first research to leverage real user engagement data from YouTube's API, providing authentic feedback about what viewers find most engaging rather than subjective human annotations.

YouTube's "Most Replayed" feature - the novel data source used for training highlight detection models
Technical Implementation
- Adapted Unified Multimodal Transformer (UMT) for highlight detection
- Multimodal fusion: Audio (PANN) + Video (I3D with RAFT optical flow)
- Cross-modal attention mechanisms for joint audio-visual learning
- 150+ YouTube videos across sports and comedy categories
- Video length: 3.5-30 minutes (much longer than typical benchmarks)
- Novel labeling: Percentile-based vs Z-score strategies from engagement data
- Can user engagement data replace manual annotations?
- Category-specific vs mixed-category model effectiveness
- Impact of different continuous-to-discrete labeling strategies
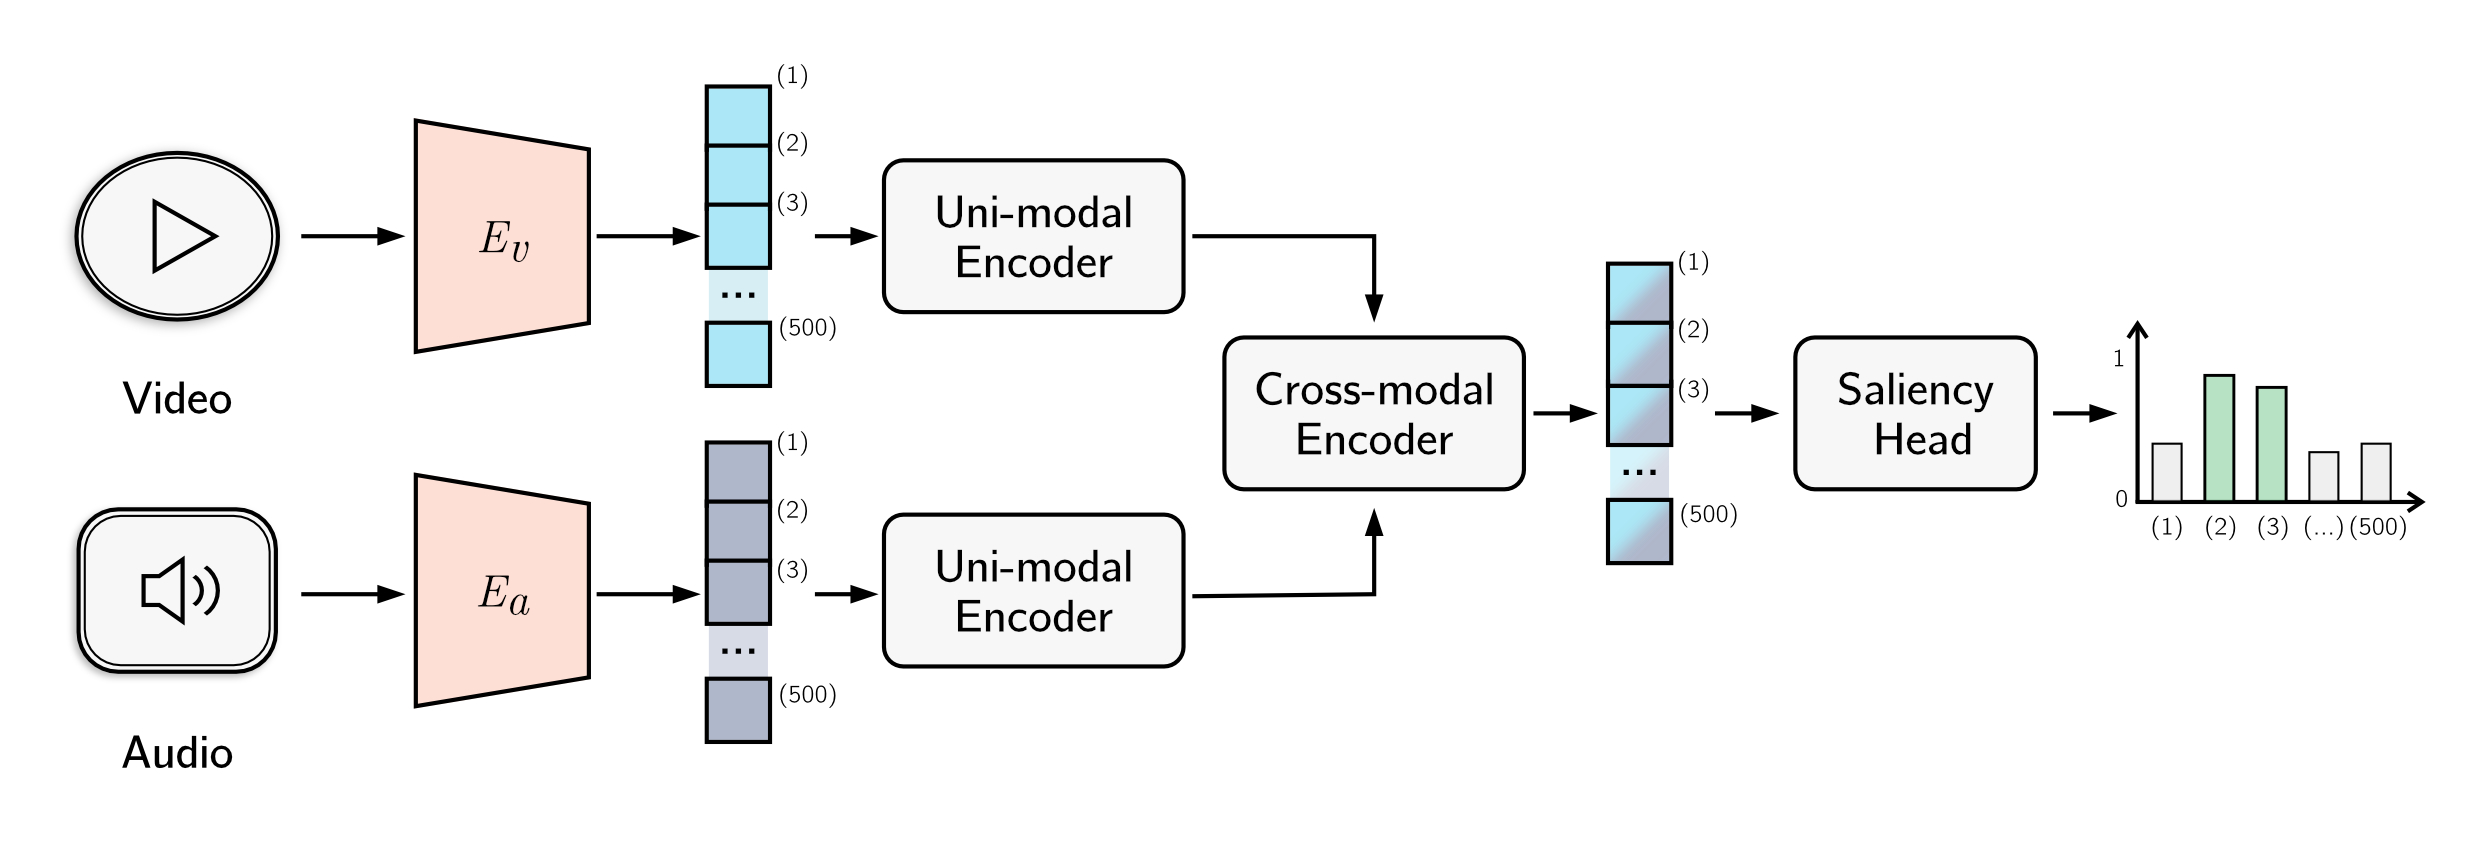
Adapted UMT architecture with multimodal fusion of audio (PANN) and video (I3D) features
UMT Architecture Deep Dive
The Unified Multimodal Transformer (UMT) framework consists of several sophisticated components working together to process video and audio data for highlight detection:
- Audio: PANN (Pretrained Audio Neural Networks) extracts 500x2048 audio embeddings from WAV files using Wavegram-Logmel-CNN architecture
- Video: I3D (Inflated 3D ConvNet) processes RGB frames and RAFT optical flow, creating 500x1024 embeddings for each modality
- Address the limitation of local-only context in feature extractors by using transformer self-attention mechanisms
- Each video segment receives global context about the entire video through attention, crucial for determining highlight-worthiness
- Output: 500x256 contextually-aware representations for each modality
- Implements bottleneck attention mechanism for efficient multimodal fusion
- Compression Stage: Bottleneck tokens capture compressed features from all modalities
- Expansion Stage: Compressed information propagated back to enhance each modality
- Maintains linear computational complexity while minimizing noise incorporation
- Multi-Layer Perceptron (MLP) that makes individual predictions for each of the 500 video segments
- Each prediction leverages the rich, contextually-aware representations from previous layers
- Outputs probability scores indicating highlight-worthiness for each temporal segment
Continuous-to-Binary Labeling Methodology
A critical innovation in this research was developing methods to convert YouTube's continuous "Most Replayed" engagement scores (0-100) into binary highlight labels for supervised learning. I developed and compared two distinct approaches:
This method adapts to the distribution of engagement within each video, ensuring consistent proportions of highlights across the dataset.
- Formula: If engagement_score ≥ percentile_threshold, then label = 1
- Thresholds tested: 97th (3%), 90th (10%), 85th (15%), 80th (20%), 75th (25%), 70th (30%)
- Advantage: Consistent proportion of highlights per video, stable for model training
- Limitation: May label relatively unengaging moments as highlights in low-engagement videos
This method identifies segments that are statistical outliers in terms of engagement, capturing moments that deviate significantly from the video's average engagement.
- Formula: If engagement_score > μ + (x × σ), then label = 1
- Where: μ = mean engagement, σ = standard deviation, x ∈ 2.5
- Constraint: Ensured each video has at least one highlight to prevent edge cases
- Advantage: Captures "true highlights" as significant deviations from average
- Limitation: Variable number of highlights per video, potentially inconsistent training data
Percentile-based labeling generally outperformed z-score methods, particularly for sports content. The stability of having consistent highlight proportions proved more beneficial for model learning than the theoretical advantage of identifying statistical outliers. This finding validates the importance of dataset consistency in supervised learning scenarios.
Video Segmentation and Processing Pipeline
The processing pipeline transforms raw YouTube videos into model-ready data through several technical steps:
- Custom Python framework using PyTube for video download and Google API for metadata
- LemnosLife API integration for "Most Replayed" data extraction
- Automated filtering: English language, 3.5-30 minutes duration, "Most Replayed" feature enabled
- YouTube provides engagement data as 100 equal-length segments
- Extended to 500 segments for finer granularity (1-3 second windows depending on video length)
- Original labels replicated 5x to maintain alignment with engagement data
- Computational constraint: 500 segments maximum due to VRAM limitations during processing
- Dockerized environment ensuring reproducible feature extraction across computing platforms
- Parallel processing of audio and video streams with AWS S3 storage integration
- Database tracking for metadata, processing status, and file locations
Key Results & Findings
- Competitive Performance: Achieved mAP@5 of 0.8513 for sports videos, outperforming TVSum benchmark (0.8314)
- Novel Data Source Validated: Proved user engagement data can accurately identify highlights without manual annotation
- Category Insights: Mixed-category models outperformed category-specific ones for sports, while comedy benefited from specialization
- Labeling Strategy Impact: Percentile-based labeling generally outperformed Z-score methods for user engagement data
- Long-form Video Capability: Successfully extended highlight detection to videos 6x longer than typical benchmarks
Model Performance Visualization
The visualizations below show how well the model's predictions (orange line) align with actual user engagement patterns from YouTube's "Most Replayed" data (blue line). Red dots indicate the model's top 5 highlight predictions.
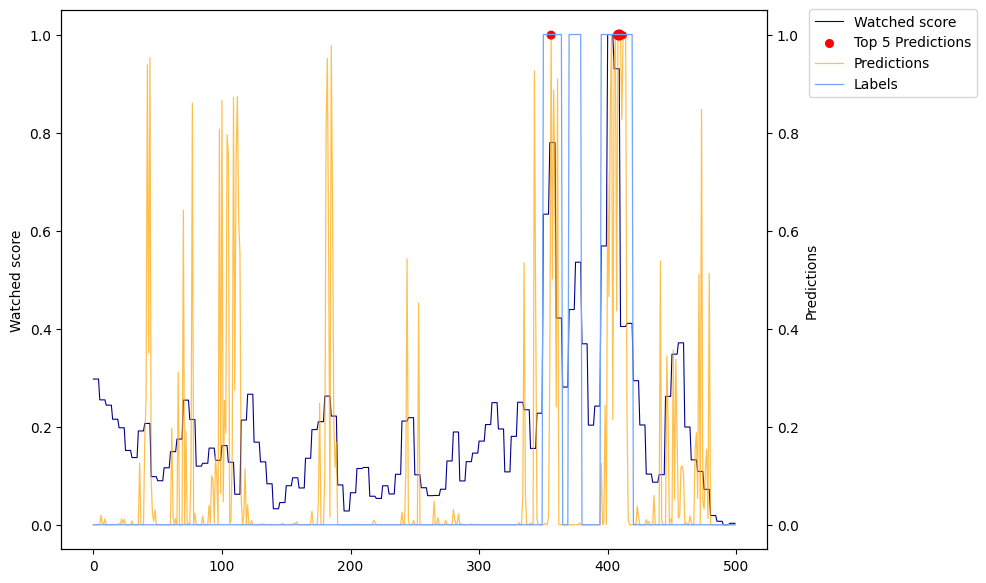
90th percentile threshold (10% highlights) - More precise but conservative predictions
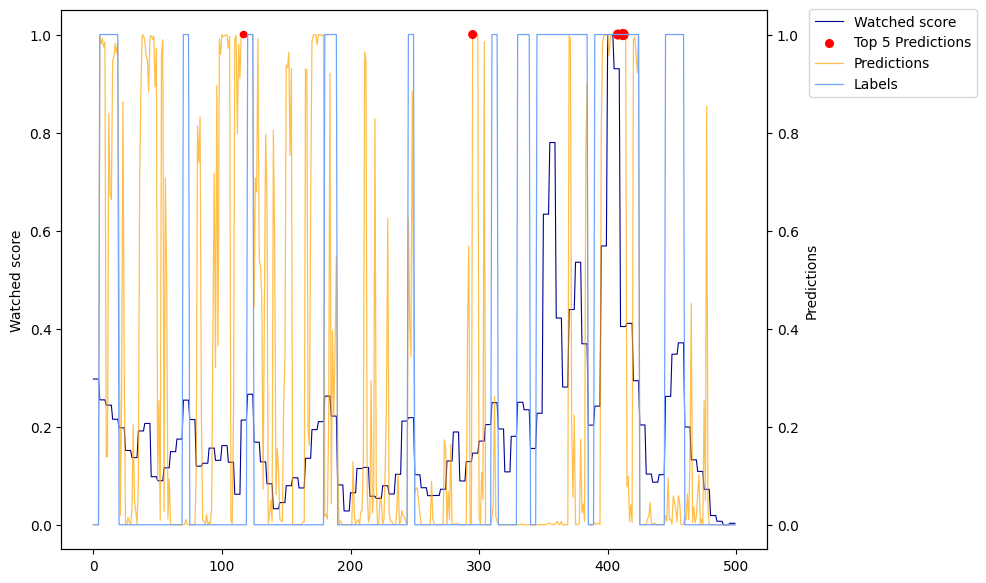
70th percentile threshold (30% highlights) - Broader highlight detection
Performance Comparison with Benchmarks
Comparison of our models with established benchmark datasets shows competitive performance, especially considering our use of longer videos and novel labeling approach:
| Benchmark/Model | Highlights (%) | Metric | Score |
|---|---|---|---|
| QVHighlights (UMT) | 37.9% | mAP | 0.3985 |
| Our Comedy Model | 30% | mAP | 0.3357 |
| TVSum (UMT) | 33.2% | mAP@5 | 0.8314 |
| Our Sports Model (Best) | 30% | mAP@5 | 0.8513 |
| YouTube Highlights (UMT) | 43.2% | mAP | 0.7493 |
| Our Sports Model | 30% | mAP | 0.3920 |
Note: Our models were trained on significantly longer videos (3.5-30 minutes) compared to typical benchmarks (<5 minutes) and used real user engagement data rather than manual annotations.
Category-Specific vs Mixed-Category Results
One key finding was that the optimal modeling approach varies by content type:
| Model Type | Evaluation | mAP | mAP@5 |
|---|---|---|---|
| Comedy-Specific | Comedy | 0.3357 | 0.7285 |
| Mixed-Category (Balanced) | Comedy | 0.3077 | 0.6723 |
| Sports-Specific | Comedy | 0.3138 | 0.3598 |
| Mixed-Category (Fine-tuned) | Sports | 0.3920 | 0.8513 |
| Sports-Specific | Sports | 0.3228 | 0.6880 |
| Comedy-Specific | Sports | 0.3097 | 0.2544 |
Key insight: Comedy highlights benefit from category-specific models, while sports highlights perform better with mixed-category training, suggesting different underlying patterns in highlight characteristics.